AI Video Metrics Help Improve Operating Room Efficiency
Lead With Empathy Not Enforcment
Using Video-Based Metrics and Parallel Processing to Improve Operating Room Efficiency: A Quality Improvement Initiative
Jay Redan MD; Nicholas DeStefano BSN, RN, CNOR; Asem Ghaniam MD, Micheal McDonald MD; Rhandie DeGracia BSN, RN; Baky Potter-Perez BSN, RN, CNOR; Delilah Ortega MSN, RN, RNFA; Jaseem Khan, BSN, RN, CNOR; Frederick Pilapil RN, CNOR; Felcar Nunez MSN, RN, CSSYB, Megan Nylander RT
Abstract
Operating Room (OR) efficiency is often hampered by inaccurate, manually documented timestamps and process variability. This quality improvement study utilized real-time Artificial Intelligence (AI) video analytics to deconstruct surgical cases into four timestamped segments. By identifying bottlenecks specifically regarding on-time starts and turnover variability the facility implemented a "T-Minus" readiness protocol and a parallel processing strategy. Results showed a year-over-year increase in on-time starts from 64% to 71%, reaching a record 78.45% in May 2025, and a reduction in average turnover time by 2 minutes. This study demonstrates that AI-driven data transparency, combined with multidisciplinary coordination, can significantly increase case capacity and expedited patient care.
Introduction
Efficiency in the Operating Room is critical for financial viability and patient safety. However, manually documented OR timestamps are historically highly variable and inaccurate due to the multitude of concurrent tasks required by the surgical team. This variability often obscures the root causes of delays, creating disruptions in the patient care continuum.
Initial Quality Assurance (QA) audits at our facility revealed a concerning dip in on-time starts from 66.5% to 61.87%, despite positive patient outcomes and low infection rates. The data highlighted a paradoxical phenomenon: staff were often waiting in a fully ready OR, but the patient was not present. As noted by Parmar et al. (2024), understanding the root causes of first-case delays is essential for elective surgical procedure efficiency.
This article outlines the implementation of video-based AI metrics to "see" and deconstruct operational segments, leading to the development of a "T-Minus" protocol and parallel processing strategies that mirror a "motocross pitstop" approach to safety and speed.
Methodology
Real-Time Video Analytics
The facility integrated real-time video analytics to record and timestamp four specific segments of the operative procedure:
- Patient In to First Incision: Tasks required before the procedure begins (e.g., anesthesia induction, positioning, draping).
- Incision to Closure: The operative phase.
- Surgery Complete to Patient Out: Emergence and transfer.
- Wheels Out to Wheels In: Room turnover and preparation for the next patient.
Data Discovery
AI analysis revealed a critical correlation: for every minute a case started late, it added another three minutes to the out-of-room time, creating compounding delays into the afternoon. Furthermore, heatmaps indicated that staff were frequently waiting for first cases, and significant time was lost between cases before setup for the next patient even began.
The "T-Minus" Protocol
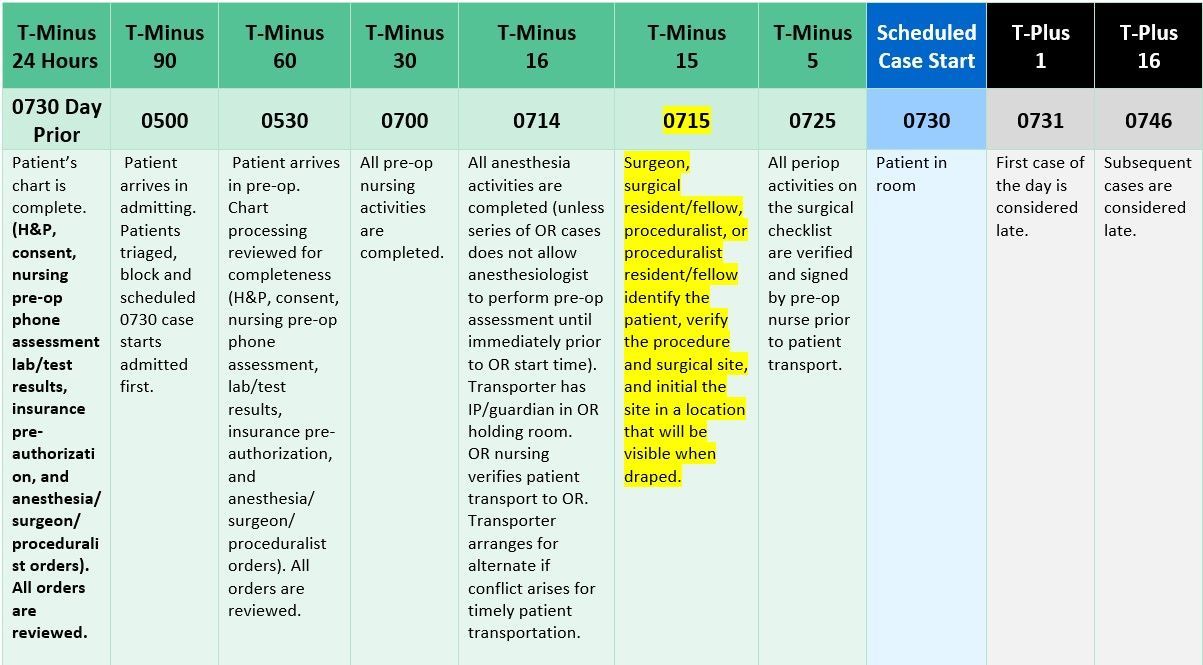
A centralized HealthPass (Preadmission Testing) initiative, while designed for patient access, created gaps in chart readiness (missing H&Ps, consents, labs). To address this, a Patient Care Coordinator position was created to audit charts and manage a "T-Minus" protocol. This protocol created standardized touchpoints at specific intervals (24 hours out, 90 mins out, etc.) to ensure the patient, surgeon, and room were synchronized.
Figure 1: The T-Minus Protocol outlining multidisciplinary responsibilities leading up to the scheduled case start.
Results
On-Time Starts
Following the implementation of the Patient Care Coordinator and T-Minus protocol, on-time starts increased year-over-year from 64% to 71%. The facility achieved a 6-year record of 78.45% on-time starts in May 2025.
Turnover Efficiency
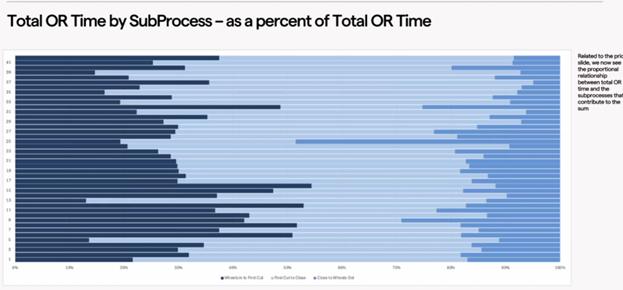
Video data analysis provided a granular look at the total OR time by subprocess, highlighting variation.
Figure 2: Analysis of Total OR Time by SubProcess as a percent of Total OR Time.
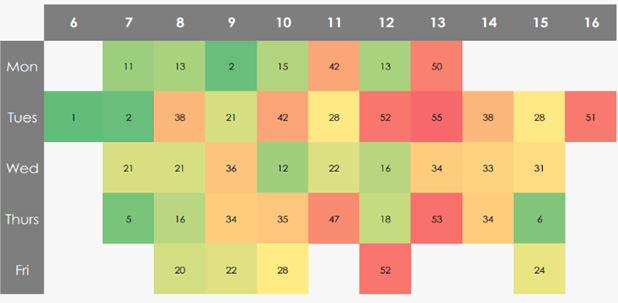
Heatmaps identifying turnover times by day of the week and hour of the day revealed that turnover times lengthened significantly as the day progressed.
Figure 3: Heatmap illustrating turnover time variation by day and hour.
Regression analysis indicated that greater than 70% of turnover variation could be explained by the hour of the day.
Figure 4: Turnover Time versus Hour of Surgery regression analysis.
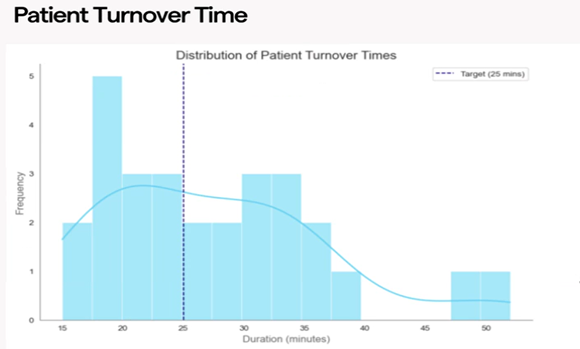
By standardizing roles and implementing parallel processing where tasks such as the nurse counting and the tech prepping occur simultaneously average turnover times were reduced by 2 minutes.
Figure 5: Distribution of Patient Turnover Times showing a shift toward the target duration.
The reduction in turnover minutes cumulatively gained back hours of operating time, resulting in the highest volume year the facility had ever seen.
Figure 6: Comparison of Room Turnover times before and after implementation.
Discussion
Parallel Processing Strategy
The core intervention involved moving from sequential to parallel processing. As Sales-Coll et al. (2021) suggest, lean management tools are vital for improving efficiency. This study applied those principles to the four timestamped segments:
- Segment 1 (Entry to Incision): While the circulator counts the back table, the anesthesia team, coordinator, and surgical aide simultaneously assist in transfer and intubation. The scrub tech begins draping immediately as the circulator completes the foley catheter.
- Segment 4 (Turnover): The surgeon dictates notes and visits the family immediately upon "wheels out," rather than delaying. Simultaneously, the preoperative team begins IVs and verification for the next patient, while the Coordinator checks the next case cart before the room is even clean.
Addressing Variation
The data revealed that "standard" turnover roles degraded during lunch hours. A new iteration of the process was created to manage breaks without disrupting the flow, keeping preferred teams with their surgeons to reduce instrumentation errors.
Interestingly, while most rooms saw dramatic reductions, some (e.g., OR 1 and GYN) saw increases. Further data drilling revealed context hidden by simple averages: OR 1 was handling direct ICU transfers, and the GYN service had shifted to more complex cases compared to previous months. This underscores the necessity of AI-driven optimization to understand the context of delays, as supported by Seal (2024).
Conclusion
By integrating real-time AI video timestamps, this facility successfully moved from anecdotal evidence to metric-based improvement. The combination of the T-Minus protocol for pre-operative readiness and parallel processing for intra-operative efficiency resulted in a safer, highly functioning environment. This approach not only respected the patient's time but unlocked significant capacity for the hospital system.
References
Parmar, A., Rathod, K., Sharma, S., Singh, A., & Wani, S. (2024). Root causes of first-case start time delays for elective surgical procedures: A quality improvement study. Patient Safety in Surgery, 18(1), 1-6. https://doi.org/10.1186/s13037-024-00405-z
Proximie INC. Proxime Surgical Telepresence & Intelligence Suite Platform; Operating Room Efficiency (ORE) Study: AdventHealth Celebration
Sales-Coll, M., de Castro, R., & Hueto-Madrid, J. A. (2021). Improving operating room efficiency using lean management tools. Production Planning & Control, 34(13), 1261–1274. https://doi.org/10.1080/09537287.2021.1998932
Seal, S. (2024). AI-driven optimization of hospital operating rooms: A case study. International Journal of Computer Trends and Technology (IJCTT), 72(10), 5–8. https://ijcttjournal.org/Volume-72%20Issue-10/IJCTT-V72I10P102.pdf?utm_source=
The Sullivan Group. (n.d.). Perioperative safety and reliability consulting services. https://www.thesullivangroup.com/RSQSolutions/


Share